rayshader
From https://github.com/tylermorganwall/rayshader:
rayshader is an open source package for producing 2D and 3D data visualizations in R. rayshader uses elevation data in a base R matrix and a combination of raytracing, spherical texture mapping, overlays, and ambient occlusion to generate beautiful topographic 2D and 3D maps. In addition to maps, rayshader also allows the user to translate ggplot2 objects into beautiful 3D data visualizations.
The models can be rotated and examined interactively or the camera movement can be scripted to create animations. Scenes can also be rendered using a high-quality pathtracer, rayrender.The user can also create a cinematic depth of field post-processing effect to direct the user’s focus to important regions in the figure. The 3D models can also be exported to a 3D-printable format with a built-in STL export function.
Installation
if (!require(rayshader)) {
    # To install the latest version from Github:
    # install.packages("devtools")
    devtools::install_github("tylermorganwall/rayshader", update = "never")
}

library(rayshader)
if (file.exists("data/terrain-medium.png")) {
small_input <- "data/terrain-medium.png"
} else {
small_input <- file.choose()
}
image_test <- data.frame(png::readPNG(small_input))
# import desert heightmap demo
if (file.exists("data/dem_01.tif")) {
localtif <- raster::raster("data/dem_01.tif")
} else {
localtif <- file.choose()
}
#And convert it to a matrix:
desertmap <- raster_to_matrix(localtif)
mapHeight <- function(image_map, image_width, image_height) {
# make a 1.0 x 1.0 plane starting at (0, 0, 0)... z is up
heights <- matrix(1, nrow = image_height, ncol = image_width)
for (y in 1:image_height) {
for (x in 1:image_width) {
heights[y, x] <- round(image_map[y, x], 6)
}
}
heights
}
heightmap <- mapHeight(image_test, length(image_test[1,]), length(image_test[, 1]))
print(nrow(heightmap)) # width of the heightmap[1] 512
print(ncol(heightmap)) # height of the heightmap[1] 512
# print without tabs so R markdown will add it to the DOM tree of the resulting page
cat(paste('<div id="data_in_html"><script type="application/json">', jsonlite::toJSON(heightmap), '\n</script>\n</div>', sep = ""))
Examples
sunangle <- 135

montereybay %>%
    sphere_shade(sunangle = sunangle, texture = "desert") %>%
    add_water(detect_water(montereybay), color = "desert") %>%
    plot_map()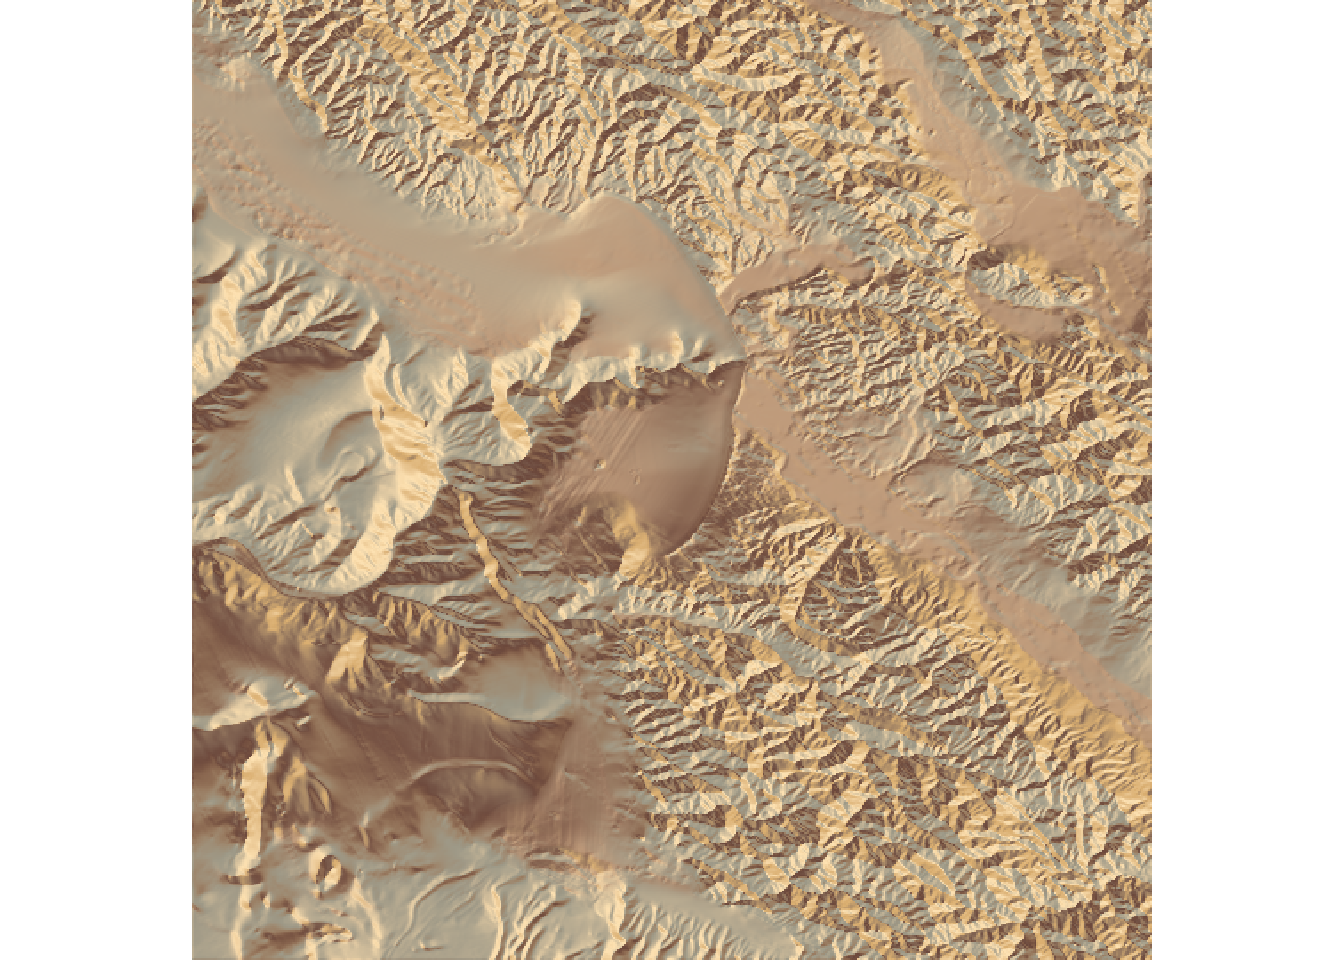
desertmap %>%
    sphere_shade(sunangle = sunangle, texture = "desert") %>%
    add_water(detect_water(desertmap), color = "desert") %>%
    plot_map()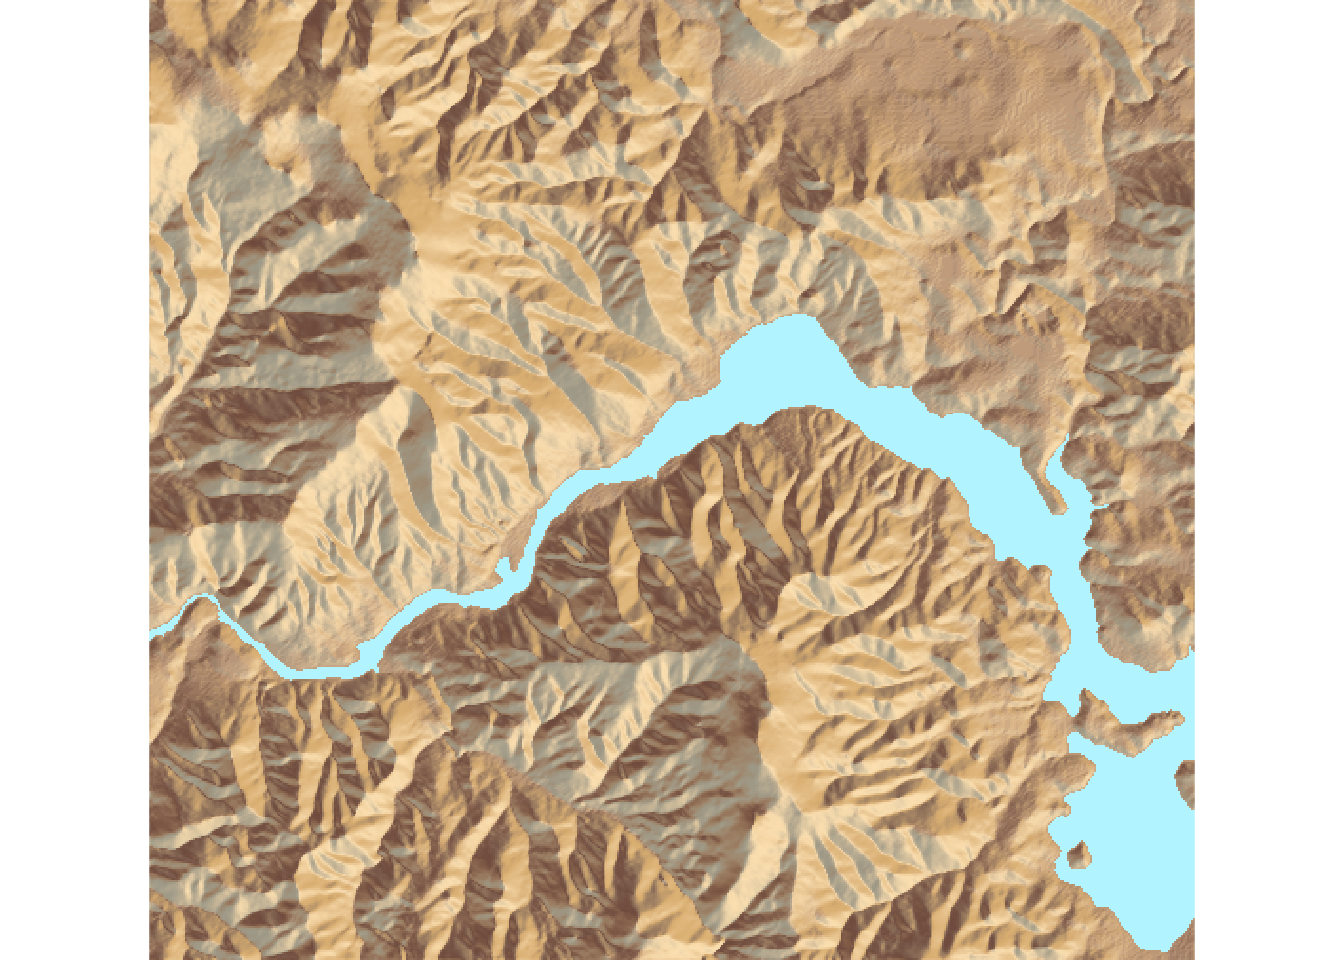
#First we ray trace the Monterey Bay dataset.
#The default angle is from 40-50 degrees azimuth, from the north east.
# \donttest{
montereybay %>%
 ray_shade(zscale = 50) %>%
 plot_map()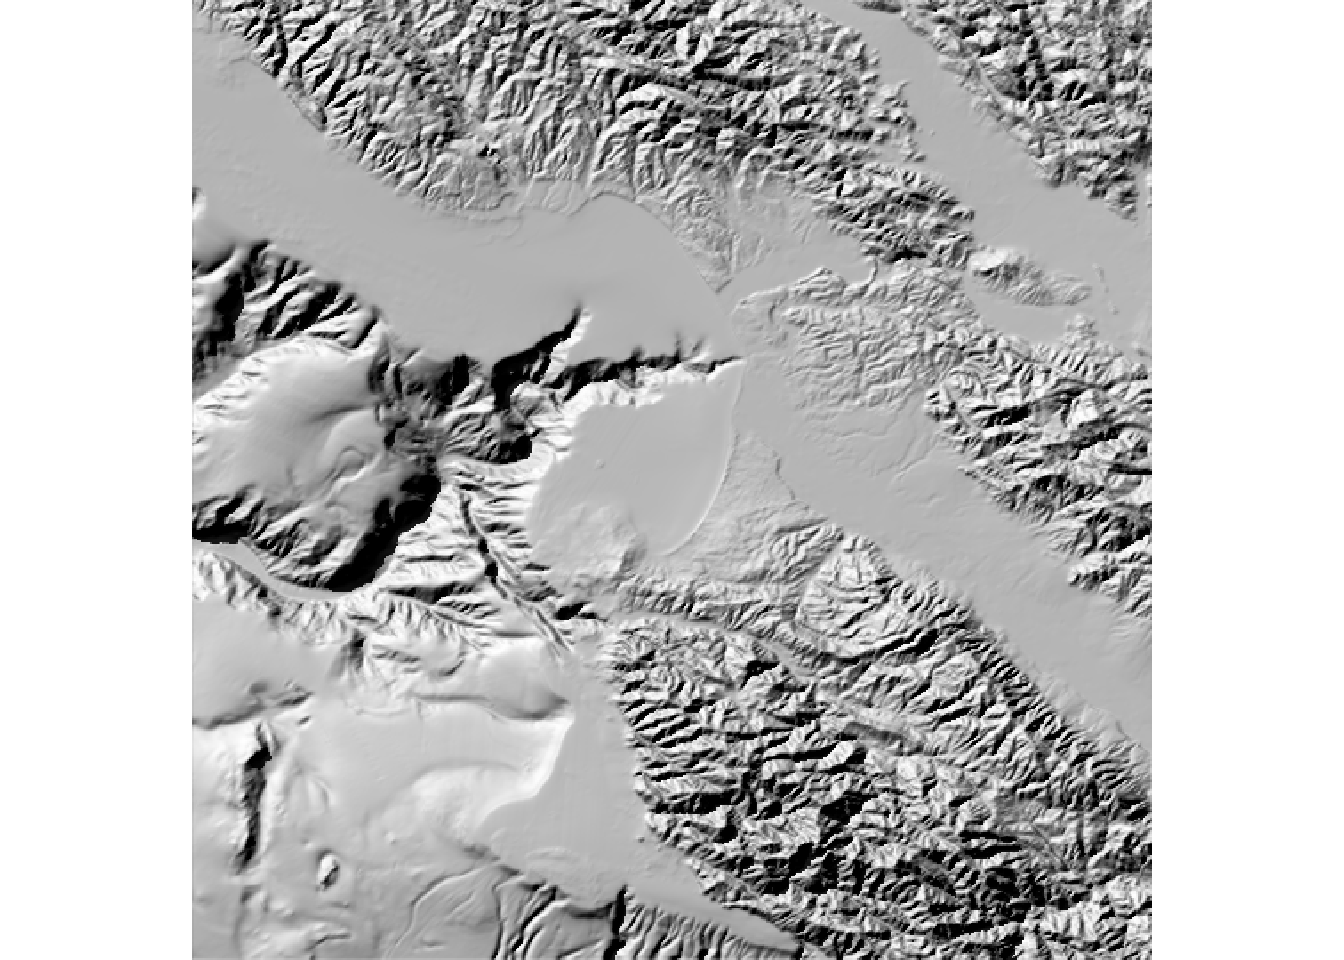
# }

desertmap %>%
 ray_shade(zscale = 50) %>%
 plot_map()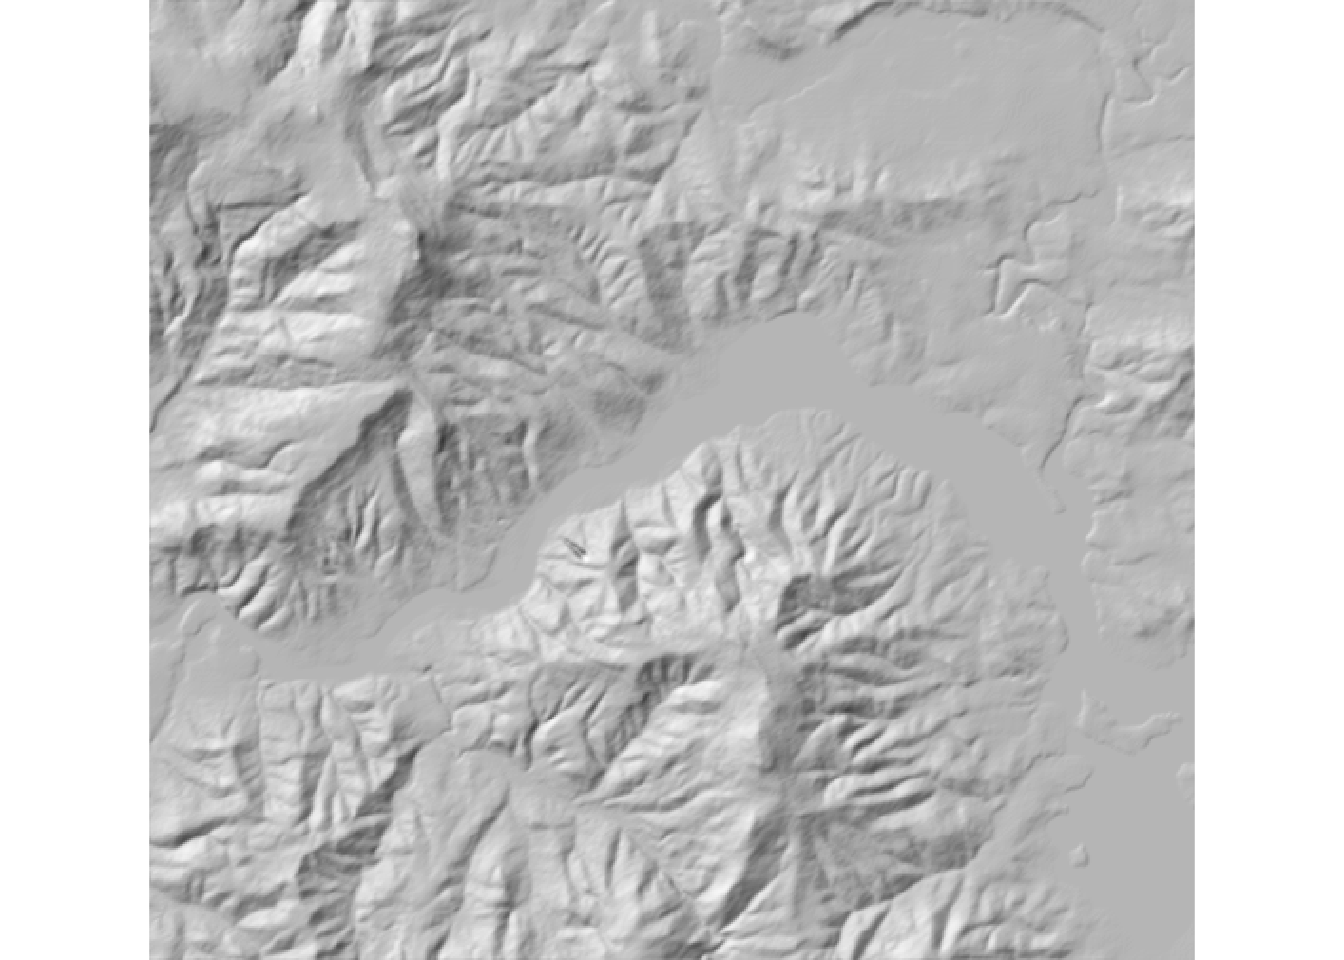
#Change the altitude of the sun to 25 degrees
# \donttest{
montereybay %>%
 ray_shade(zscale = 50, sunaltitude = 25) %>%
 plot_map()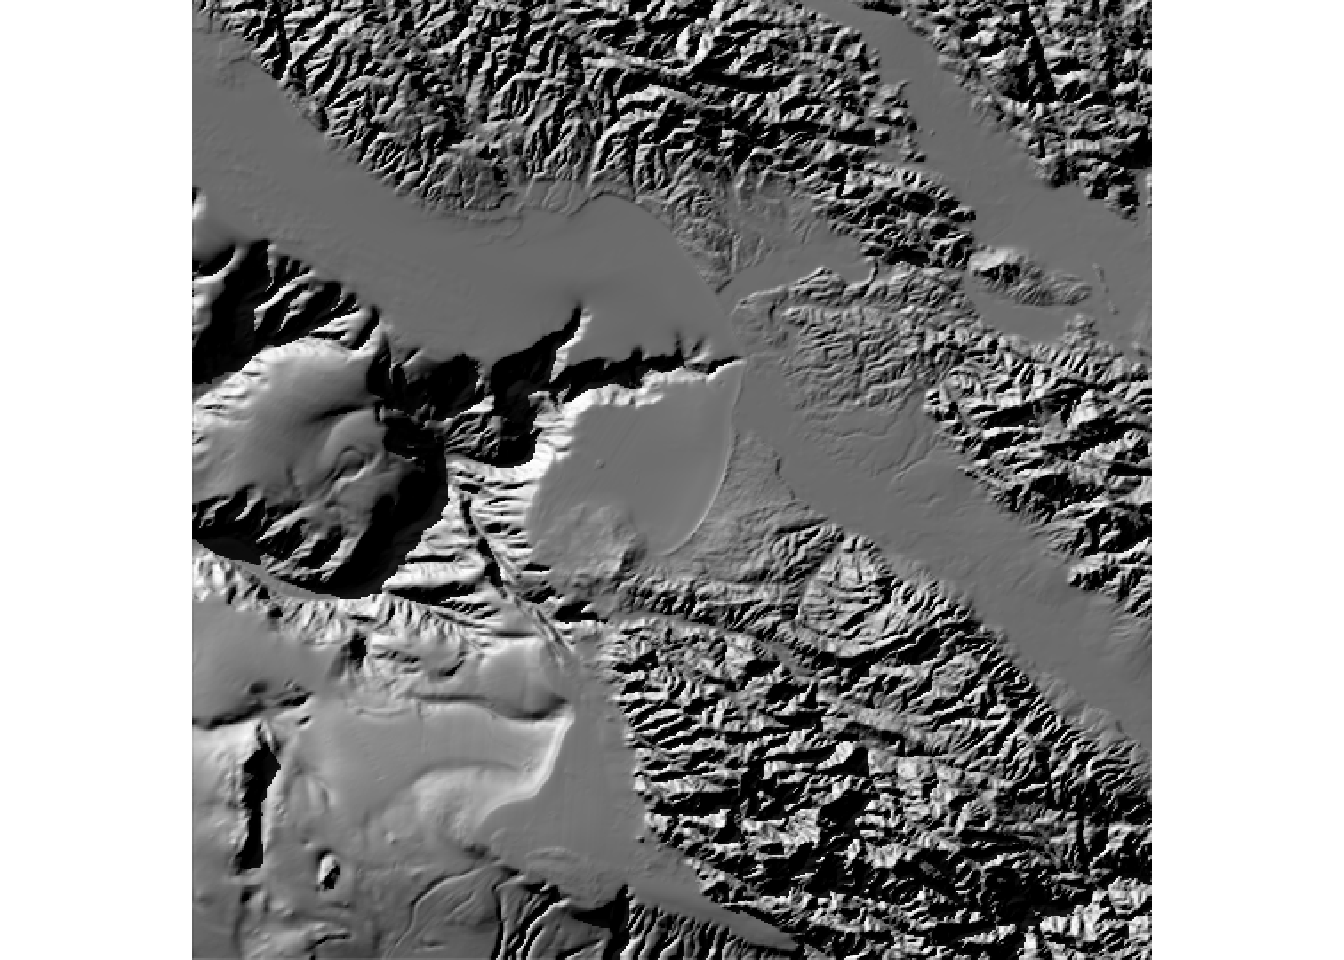
# }


desertmap %>%
 ray_shade(zscale = 50, sunaltitude = 25) %>%
 plot_map()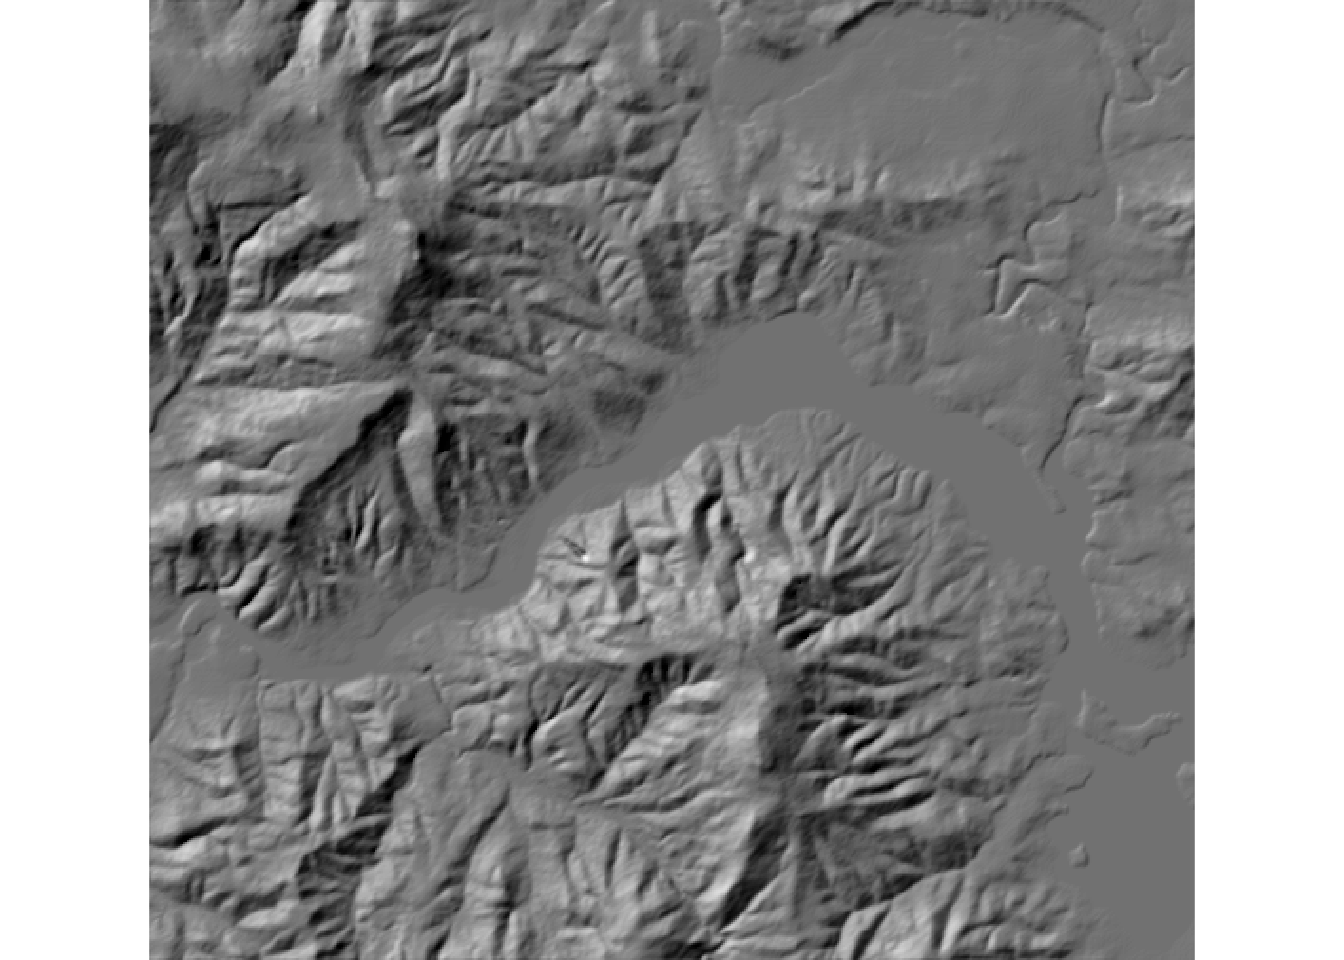
#Remove the lambertian shading to just calculate shadow intensity.
# \donttest{
montereybay %>%
 ray_shade(zscale = 50, sunaltitude = 25, lambert = FALSE) %>%
 plot_map()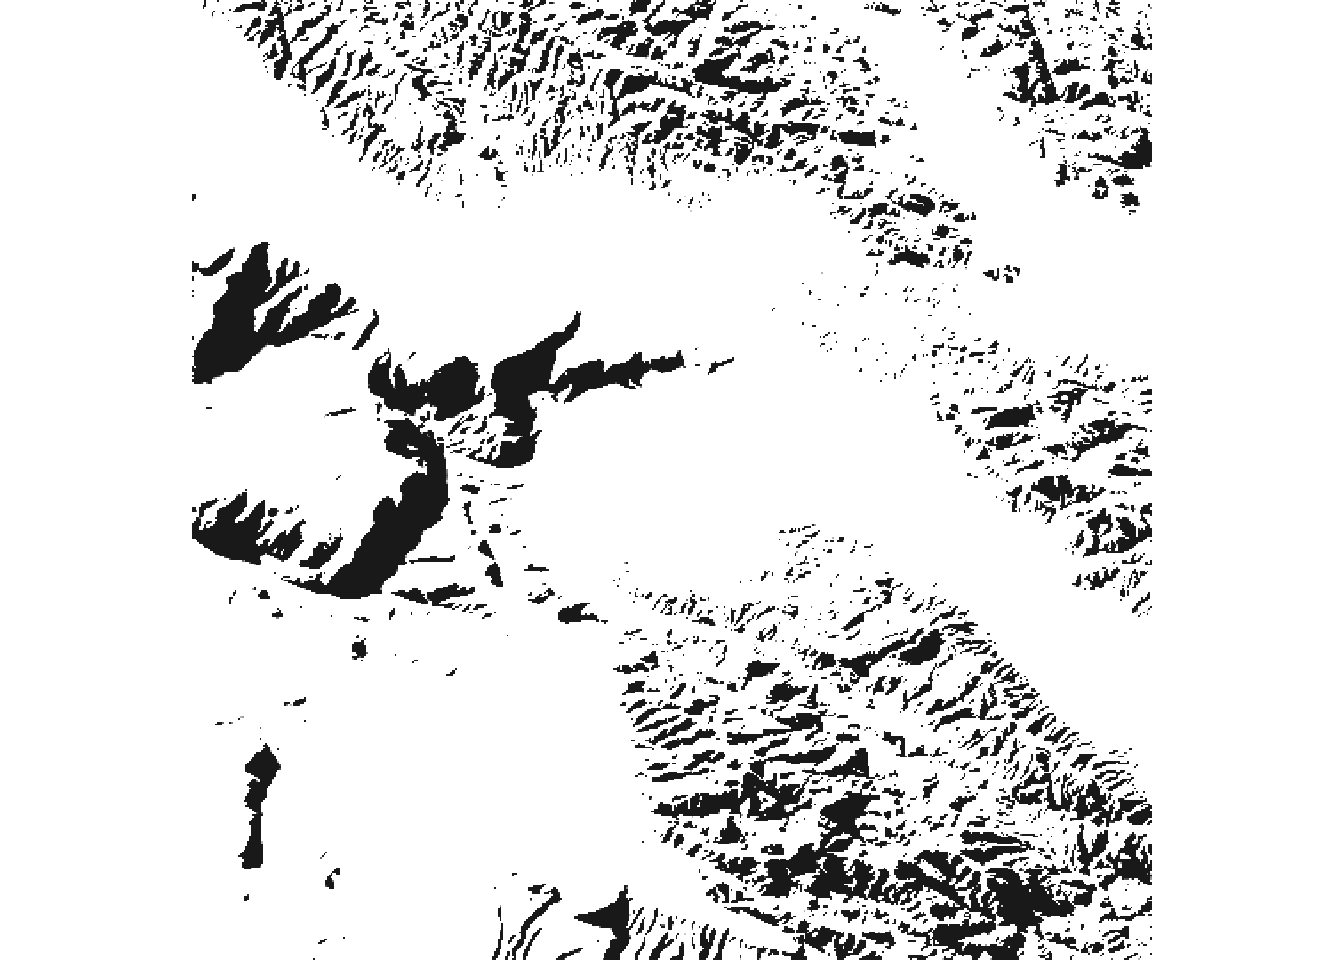
# }

desertmap %>%
 ray_shade(zscale = 50, sunaltitude = 25, lambert = FALSE) %>%
 plot_map()
# How does the montereybay dataset compare to the desert test dataset?
desertmap_max <- max(apply(desertmap, 1, max))
print(desertmap_max)
[1] 971
montereybay_max <- max(apply(montereybay, 1, max))
print(montereybay_max)
[1] 1515.887
height_mult <- montereybay_max / desertmap_max
print(height_mult)
[1] 1.56116
for (y in 1:nrow(desertmap)) {
    for (x in 1:ncol(desertmap)) {
        desertmap[y, x] <- desertmap[y, x] * (height_mult)
    }
}

max(apply(desertmap, 1, max))
[1] 1515.887
#Remove the lambertian shading to just calculate shadow intensity.
# \donttest{
desertmap %>%
 ray_shade(zscale = 50, sunaltitude = 25, lambert = FALSE) %>%
 plot_map()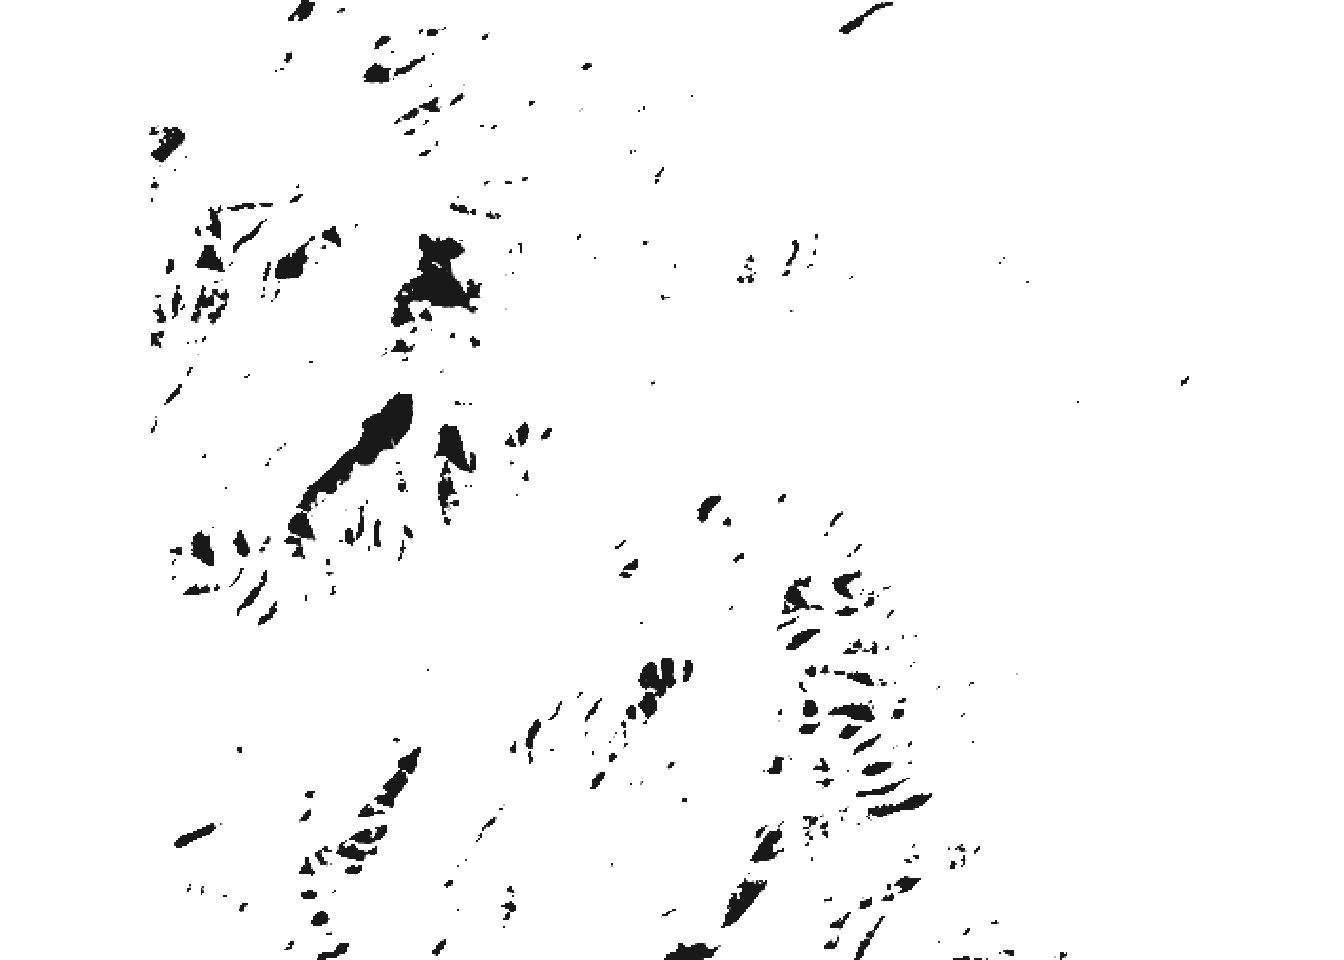
# }

#Change the direction of the sun to the South East
# \donttest{
montereybay %>%
 ray_shade(zscale = 50, sunaltitude = 25, lambert = FALSE, sunangle = sunangle) %>%
 plot_map()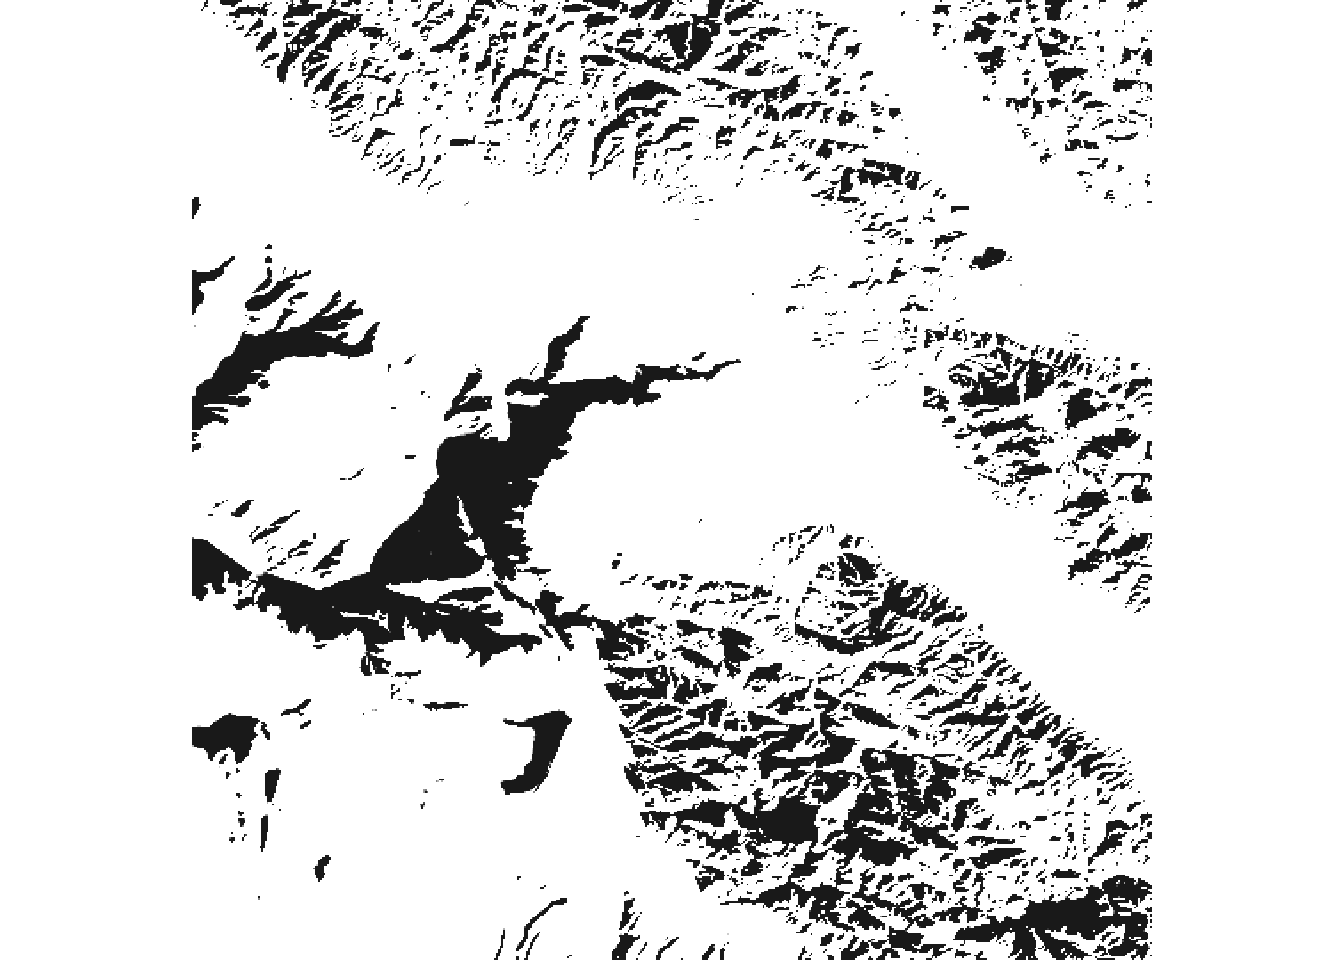
# }

#Change the direction of the sun to the South East
# \donttest{
desertmap %>%
 ray_shade(zscale = 50, sunaltitude = 25, lambert = FALSE, sunangle = sunangle) %>%
 plot_map()
# }

heightmap_max <- max(apply(heightmap, 1, max))
print(heightmap_max)
[1] 0.992157
desertmap_max <- max(apply(desertmap, 1, max))
print(desertmap_max)
[1] 1515.887
height_mult <- desertmap_max / heightmap_max
print(height_mult)
[1] 1527.87
print(max(apply(heightmap, 1, max) * c(height_mult)))[1] 1515.887
image_height <-nrow(heightmap)
heights <- matrix(1, image_height, image_height)
# Normalize and re-orient
for (y in 1:image_height) {
    for (x in 1:image_height) {
        #print(paste0(x, ", ", y, ": ", heightmap[((512 + 1) - y), x], " => ", heightmap[((512 + 1) - y), x] * (height_mult)))
        heights[y, x] <- heightmap[x, y] * (height_mult)
    }
}

max(apply(heights, 1, max))
[1] 1515.887
heights %>%
    sphere_shade(sunangle = sunangle, texture = "desert") %>%
    add_water(detect_water(heights), color = "desert") %>%
    plot_map()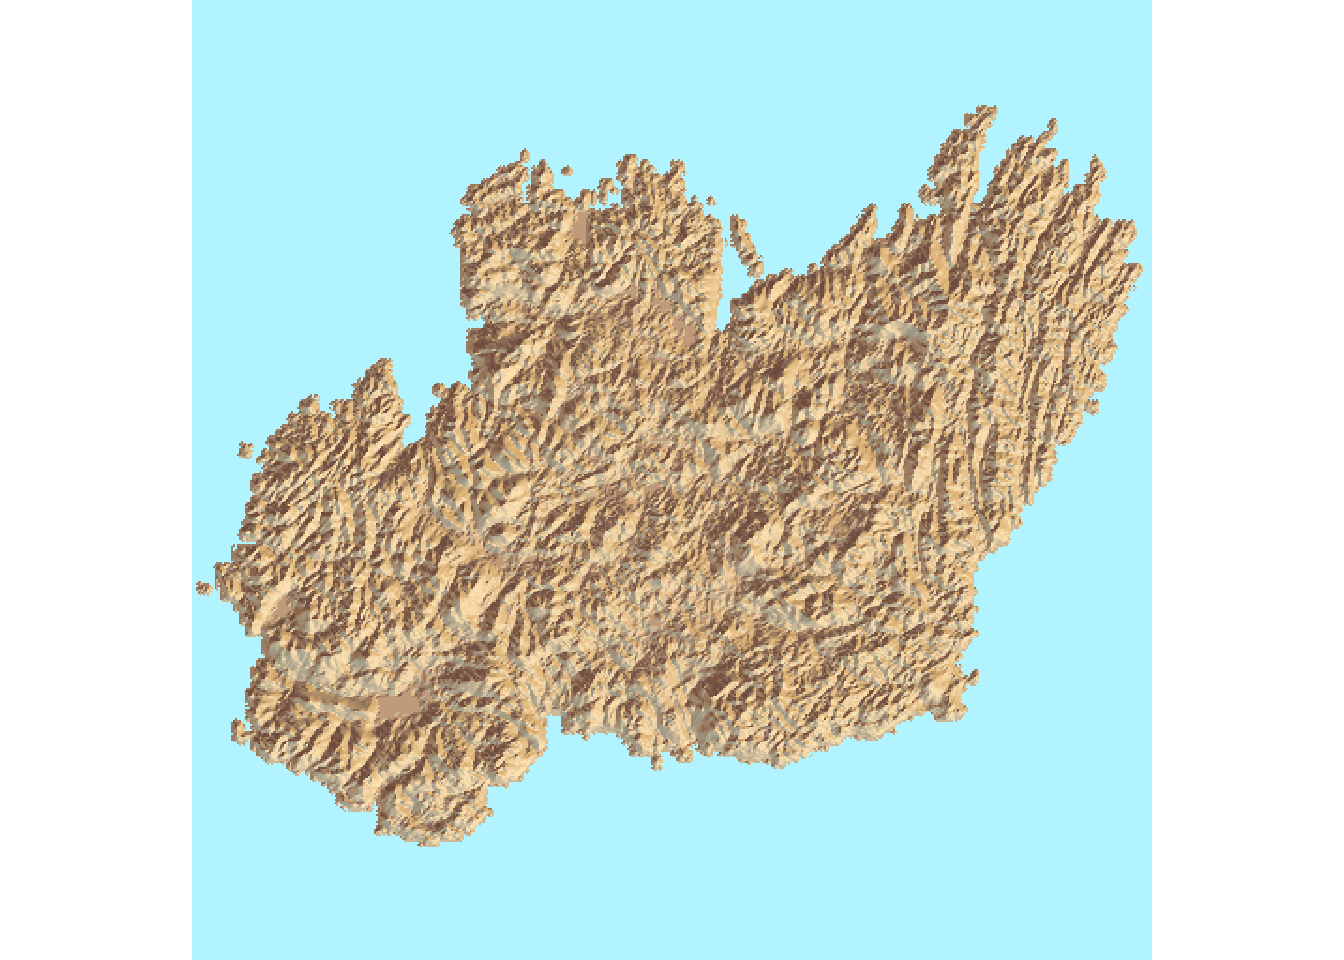
heights %>%
 ray_shade(zscale = 100) %>%
 plot_map()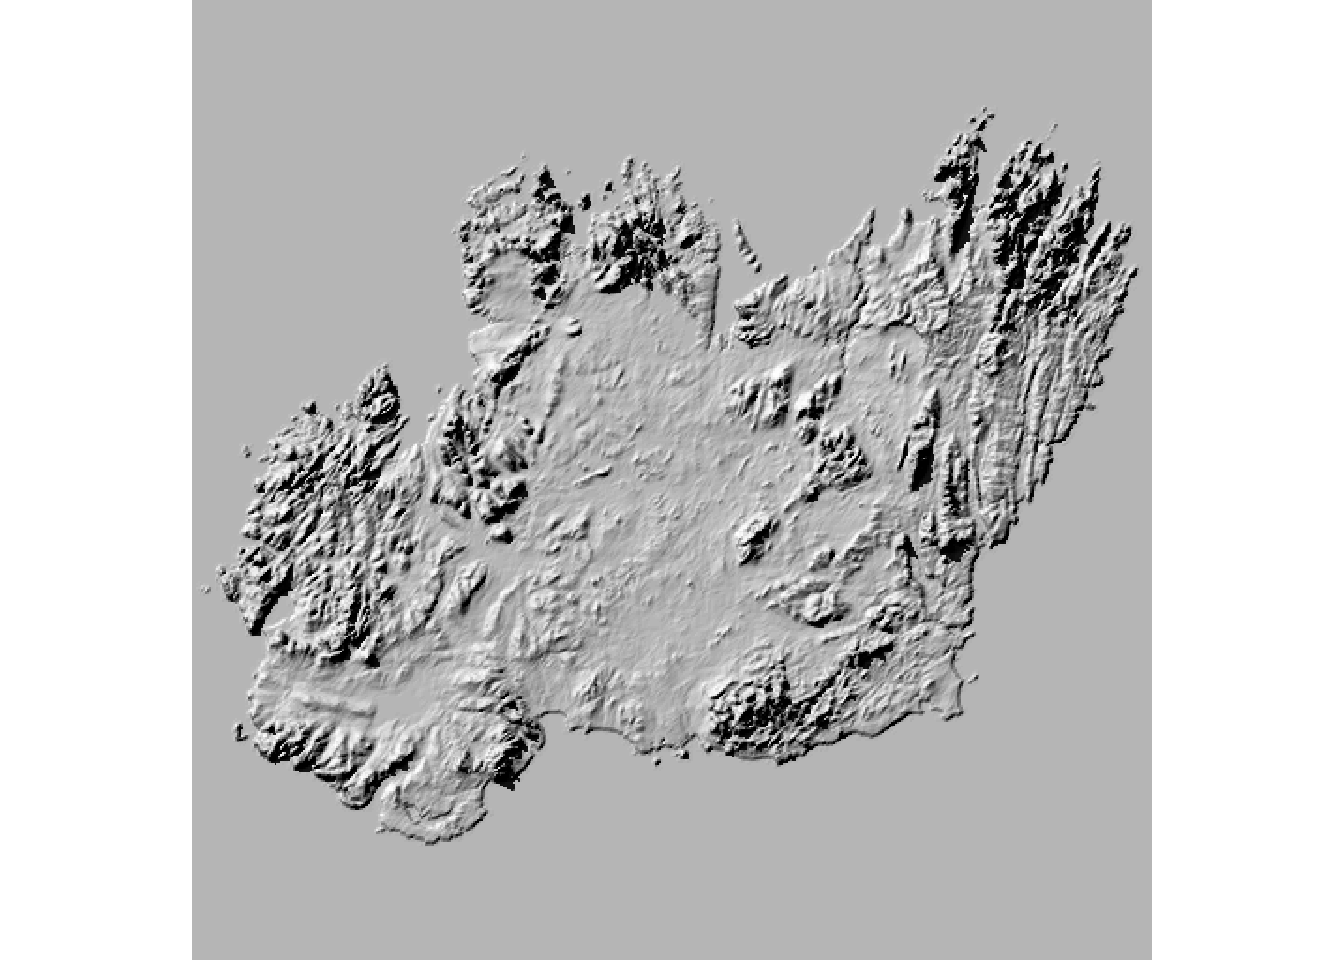
#Change the altitude of the sun to 25 degrees
# \donttest{
heights %>%
 ray_shade(zscale = 100, sunaltitude = 45) %>%
 plot_map()
# }

#Remove the lambertian shading to just calculate shadow intensity.
# \donttest{
heights %>%
 ray_shade(zscale = 100, sunaltitude = 45, lambert = FALSE) %>%
 plot_map()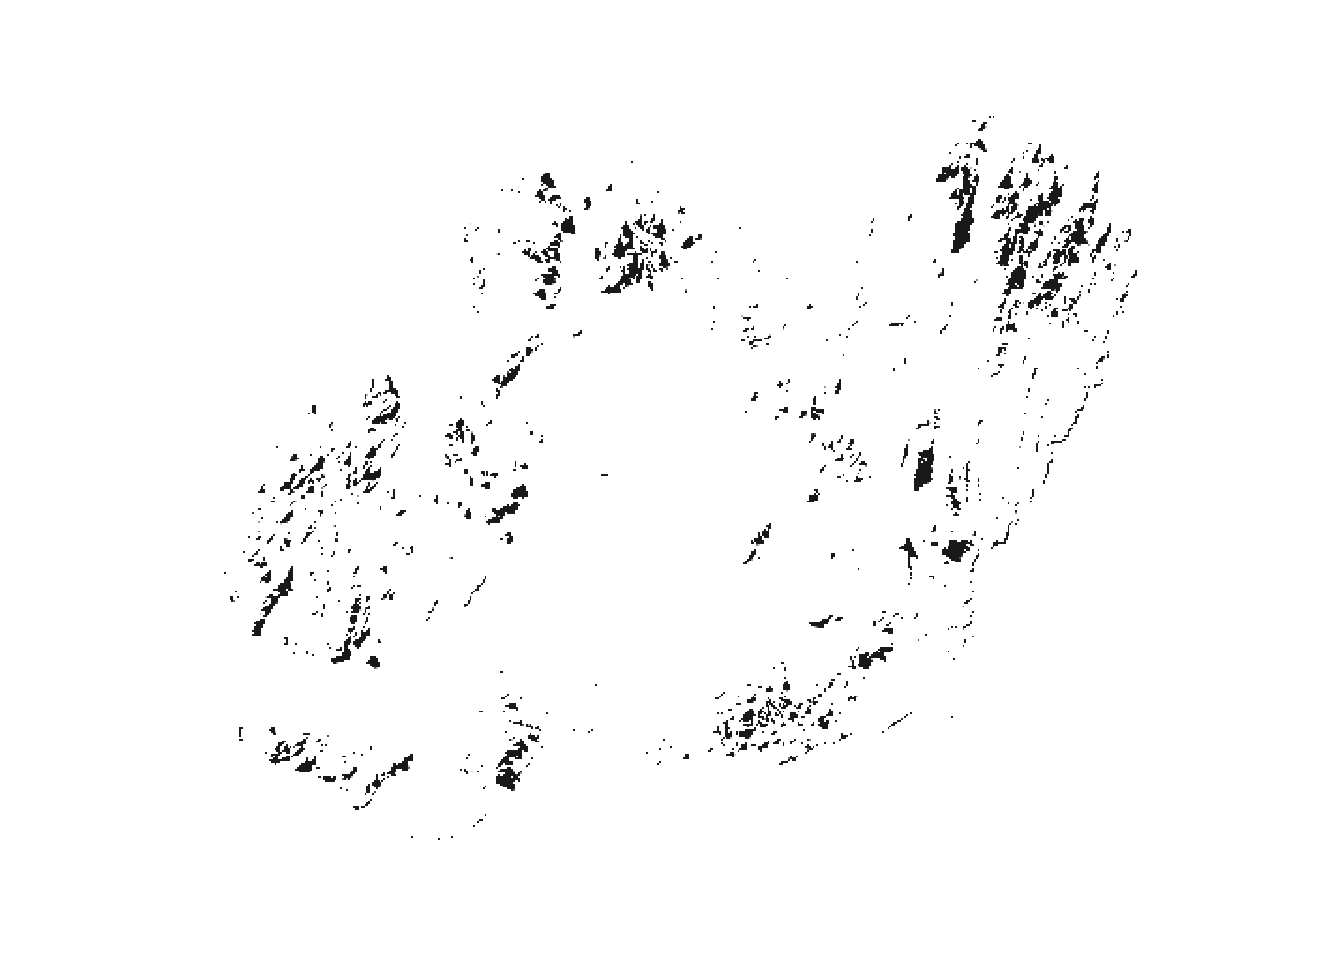
# }

#Change the direction of the sun to the South East
# \donttest{
heights %>%
 ray_shade(zscale = 100, sunaltitude = 45, lambert = FALSE, sunangle = sunangle) %>%
 plot_map()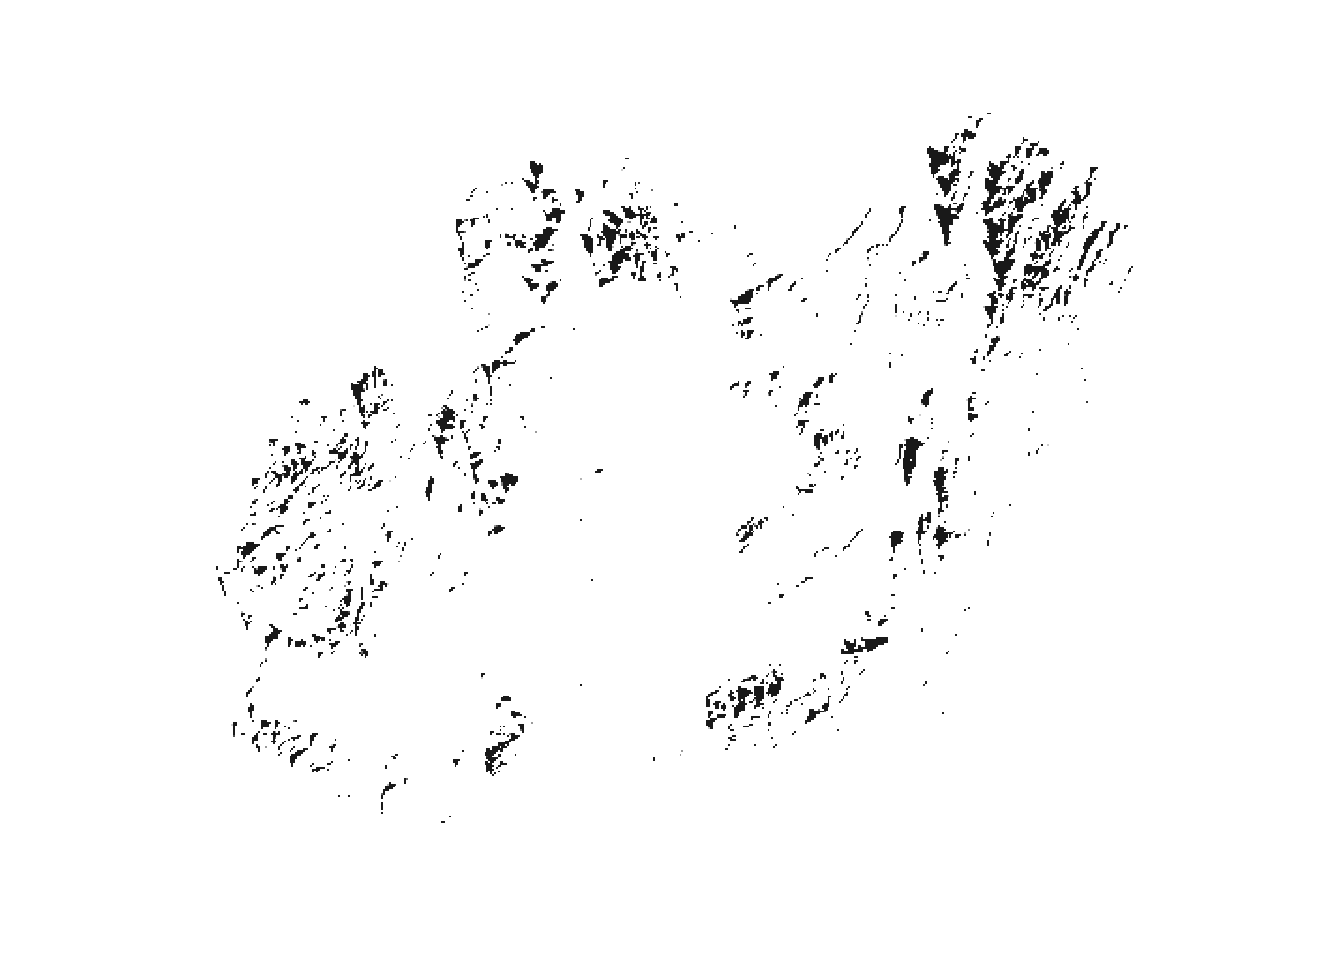
# }

#revx_elmat <- elmat
revx_heights <- matrix(1, nrow = nrow(heights), ncol = ncol(heights))
for (y in 1:512) {
    for (x in 1:512) {
        revx_heights[y, x] <- heights[(512 - y) + 1, x]
    }
}

sunang <- sunangle * pi / 180

angle <- -90 / 180 * pi
diffangle <- 90 / 180 * pi
numberangles <- 25
anglebreaks <- seq(angle, diffangle, length.out = numberangles)

single_angle <- ray_shade(
    heightmap = revx_heights,
    #anglebreaks = anglebreaks,
    maxsearch = floor(sqrt(nrow(revx_heights)^2 + ncol(revx_heights)^2)) / 64,
    zscale = 100, sunaltitude = 45, lambert = FALSE, sunangle = sunangle,
    multicore = TRUE)

if (file.exists("data")) {
    rayshader_test_file <- "data/terrain-rayshaded.png"
} else {
    rayshader_test_file <- file.choose(new = TRUE)
}

##image function and ggplot is slow; save with PNG function
##from PNG package.
png::writePNG(t(single_angle), rayshader_test_file)

cat(paste0('<img id="shademap" src="/post/', rayshader_test_file, '" style="width: 100%" />'))